For debugging an Angular application some prefer debugger, some only know of console.log(), while some use tools such as Angular Augury or Angular DevTools. With this post I’m gonna introduce Angular DevTools.
Angular is a robust framework for building complex web applications. One important tools I prefer for developing and debugging Angular applications is the Angular DevTools extension, which provides a variety of features for inspecting and manipulating an Angular application at runtime. In this blog post, we will explore some of the key elements of the Angular DevTools extension and how they can be used to improve the development process.
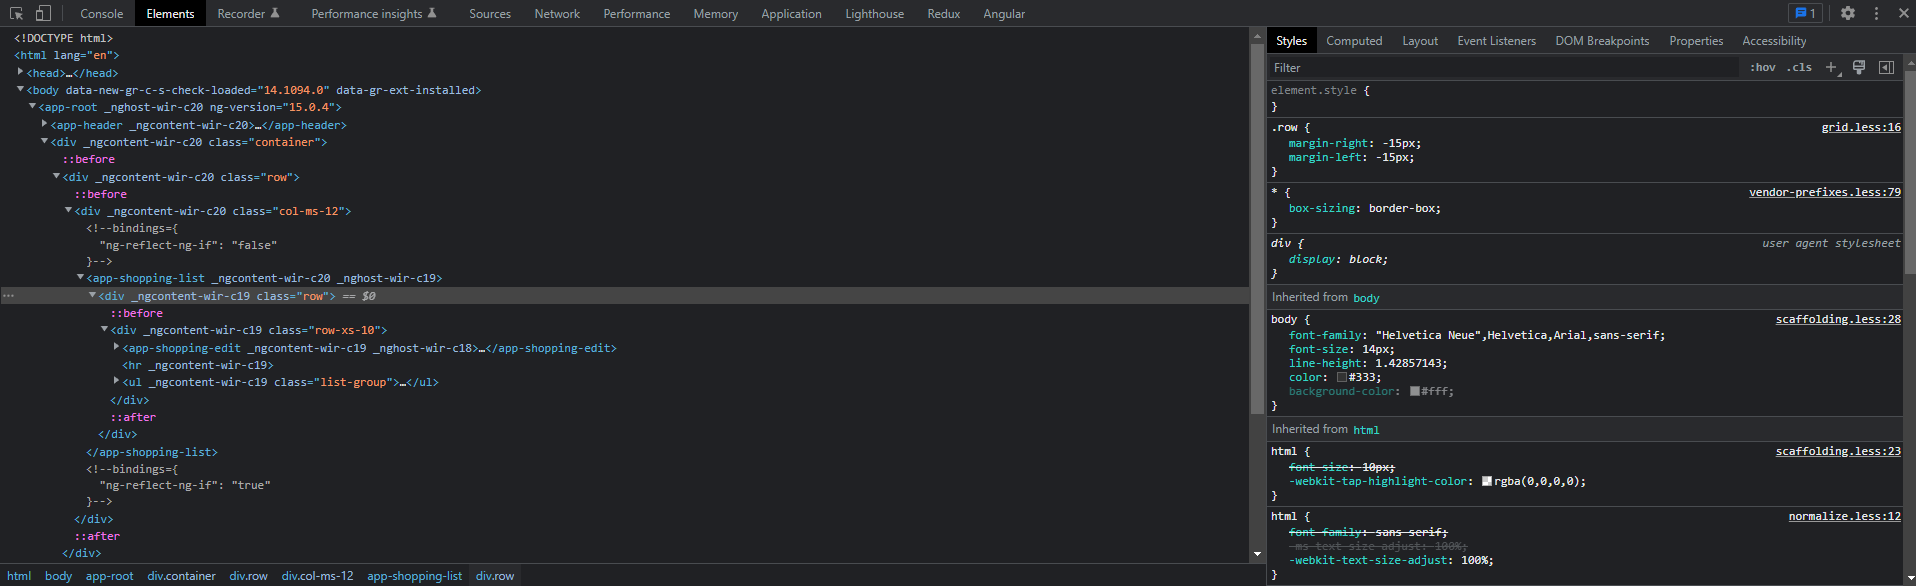
First, let’s take a look at the Elements tab, which allows you to inspect the HTML elements of your application and see how they are rendered. You can see the component tree, view the properties and state of each component, and even make changes to the HTML and see the results in real-time. This is particularly useful for debugging layout and styling issues.
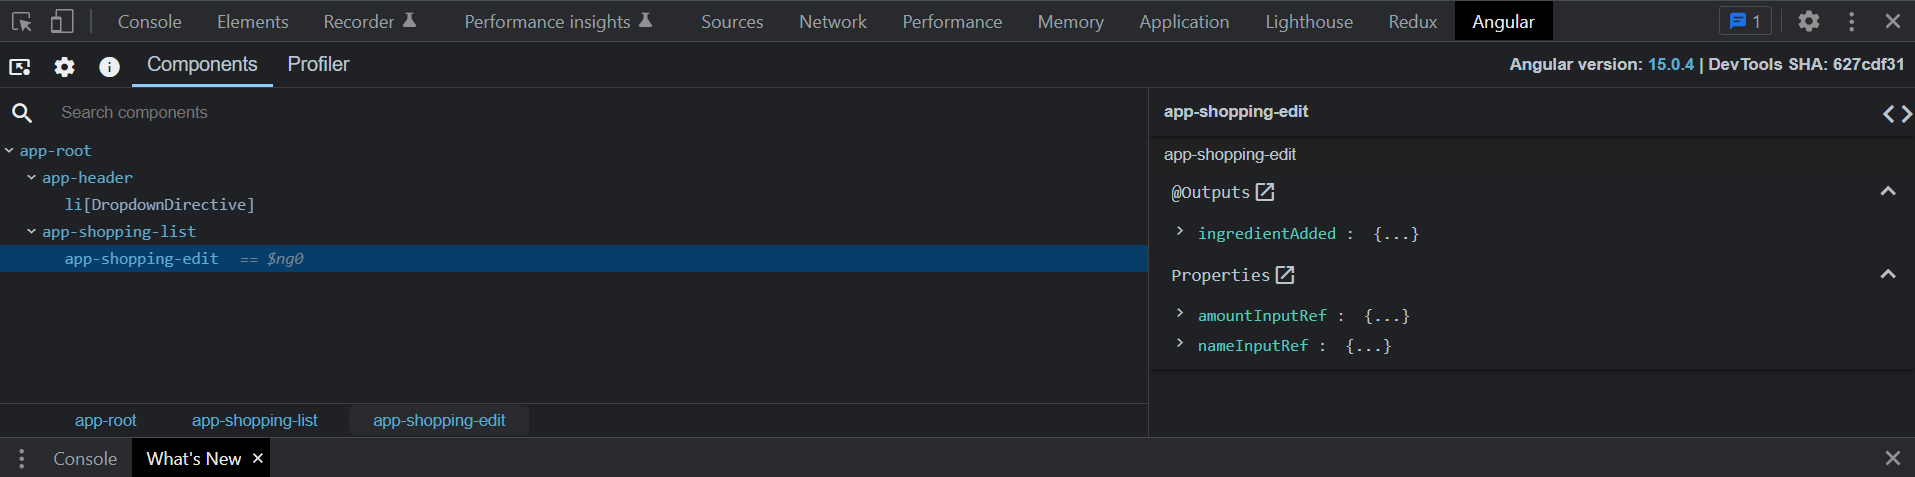
Next, let’s take a look at the Component tab, which provides detailed information about each component in your application. You can see the inputs and outputs, view the component’s lifecycle events, and even trigger change detection manually. This is particularly useful for understanding how a component works and troubleshooting issues related to data binding and change detection.
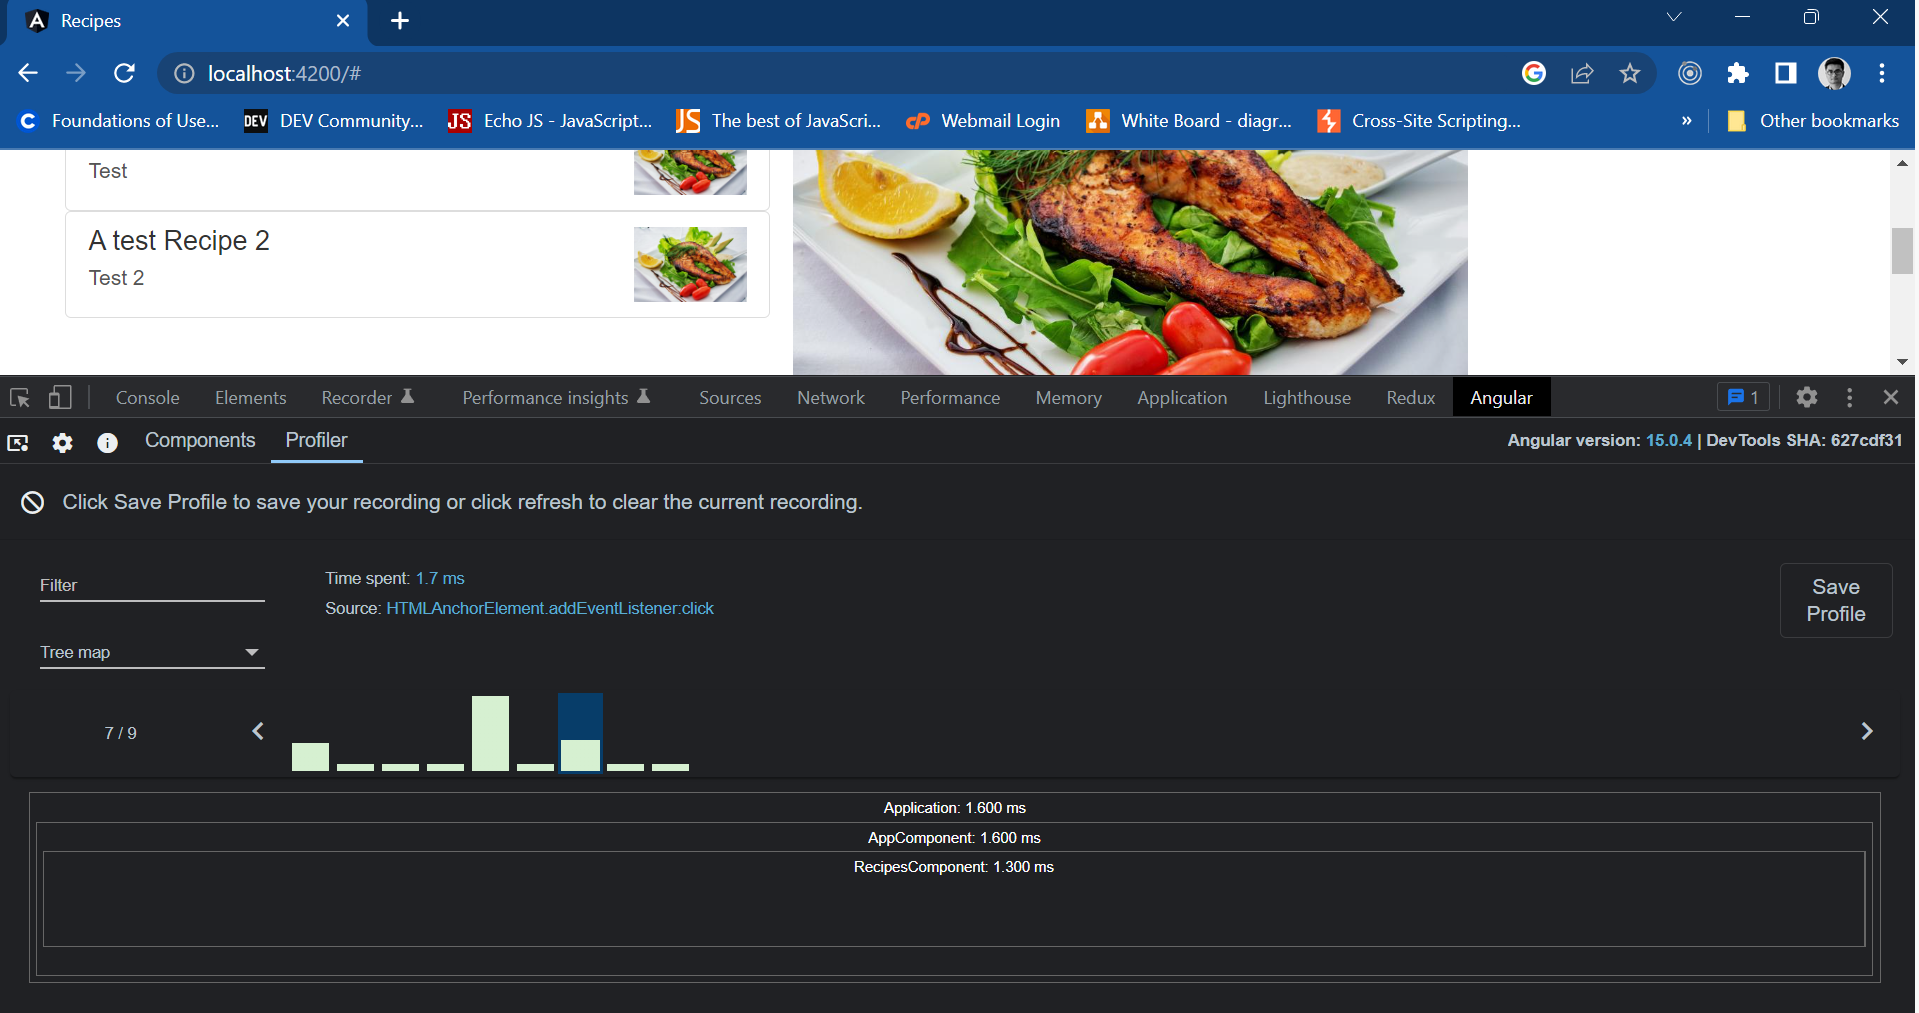
Another useful feature of the Angular DevTools extension is the Profiler tab, which allows you to profile the performance of your application and identify bottlenecks. You can see the time taken by each component to render, view the change detection cycles, and even record a profile of your application and analyze it later. This is particularly useful for optimizing the performance of your application.
In summary, the Angular DevTools extension is a powerful tool for developing and debugging Angular applications. It provides a variety of features for inspecting and manipulating an Angular application at runtime, including the ability to inspect HTML elements, view component information, profile performance, and inspect the state of your application. This extension can help you improve the development process and troubleshoot issues more efficiently.
More on the Components Tab
The Components tab in the Angular DevTools extension provides detailed information about each component in an Angular application. It can be helpful for an Angular developer in the following ways:
- Inspecting inputs and outputs: The Components tab allows developers to view the inputs and outputs of a component, which can be helpful in understanding how data is being passed between components and troubleshooting issues related to data binding.
- Viewing component lifecycle events: Developers can see the lifecycle events of a component, such as when it is created, updated, or destroyed. This can be helpful for understanding the behavior of a component and troubleshooting issues related to change detection.
- Debugging change detection: Developers can manually trigger change detection and view the resulting changes, which can be helpful for troubleshooting issues related to change detection.
- Understanding a component’s behavior: Developers can inspect the properties and state of a component and view the resulting HTML, which can be helpful for understanding how a component works and troubleshooting issues related to layout and styling.
- Inspecting change: Developers can track the changes in a component, and how they affect the overall application.
Overall, the Components tab in the Angular DevTools extension provides a wealth of information about the components in an Angular application, which can be extremely useful for understanding how a component works and troubleshooting issues related to data binding, change detection, and overall behavior of the component.
More of the Profiler Tab
The Profiler tab in the Angular DevTools extension provides information about the performance of an Angular application. It can be helpful for an Angular developer in the following ways:
- Identifying performance bottlenecks: Developers can profile the performance of their application, view the time taken by each component to render, and view the change detection cycles. This can be helpful for identifying performance bottlenecks and optimizing the performance of the application.
- Analyzing performance over time: Developers can record a profile of their application and analyze it later, which can be helpful for understanding how the performance of the application changes over time and identifying patterns or trends.
- Debugging change detection: Developers can profile the change detection cycles of the application, which can be helpful for troubleshooting issues related to change detection.
- Identifying unnecessary re-renders: Developers can inspect the time taken by the component to re-render and find the unnecessary re-renders that might be causing performance issues. Pretty common when change detection strategy is not leveraged correctly.
- Identifying the cause of a slow app: Developers can use the profiler to see the call stacks and function calls that are taking the most time and identify the cause of a slow app.
Overall, the Profiler tab in the Angular DevTools extension provides a wealth of information about the performance of an Angular application, which can be extremely useful for identifying performance bottlenecks, understanding how the performance of the application changes over time, and troubleshooting issues related to change detection and unnecessary re-renders. This information can help developers improve the performance of their applications and provide a better user experience.
If you found this blog helpful, don’t hesitate to drop a comment. Thanks.