As website owners and developers, we all know the importance of website performance. Slow loading times, clunky user interfaces, and accessibility issues can drive visitors away, resulting in lost revenue and decreased engagement.
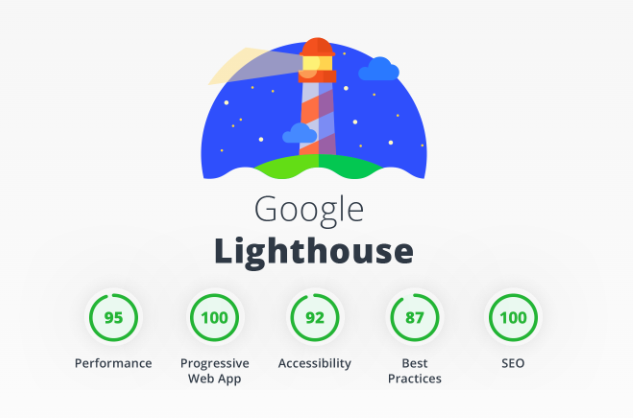
That’s where Chrome Lighthouse comes in. This powerful tool is a secret weapon in website performance optimization, providing valuable insights and recommendations to help you improve your website’s speed, accessibility, and user experience.
But what sets Chrome Lighthouse apart from its competitors? Let’s take a closer look.
Automated Testing
One of the biggest advantages of Chrome Lighthouse is its automated testing capabilities. With just a few clicks, you can run a comprehensive performance audit on your website, including tests for performance, accessibility, and SEO. This saves valuable time and resources, as you don’t have to manually test every aspect of your website.
Best Practices and Opportunities Report
Chrome Lighthouse provides a detailed report that not only identifies issues and opportunities for improvement but also suggests best practices for web development. This report can help you prioritize which areas to focus first and provides actionable recommendations for optimizing your website.
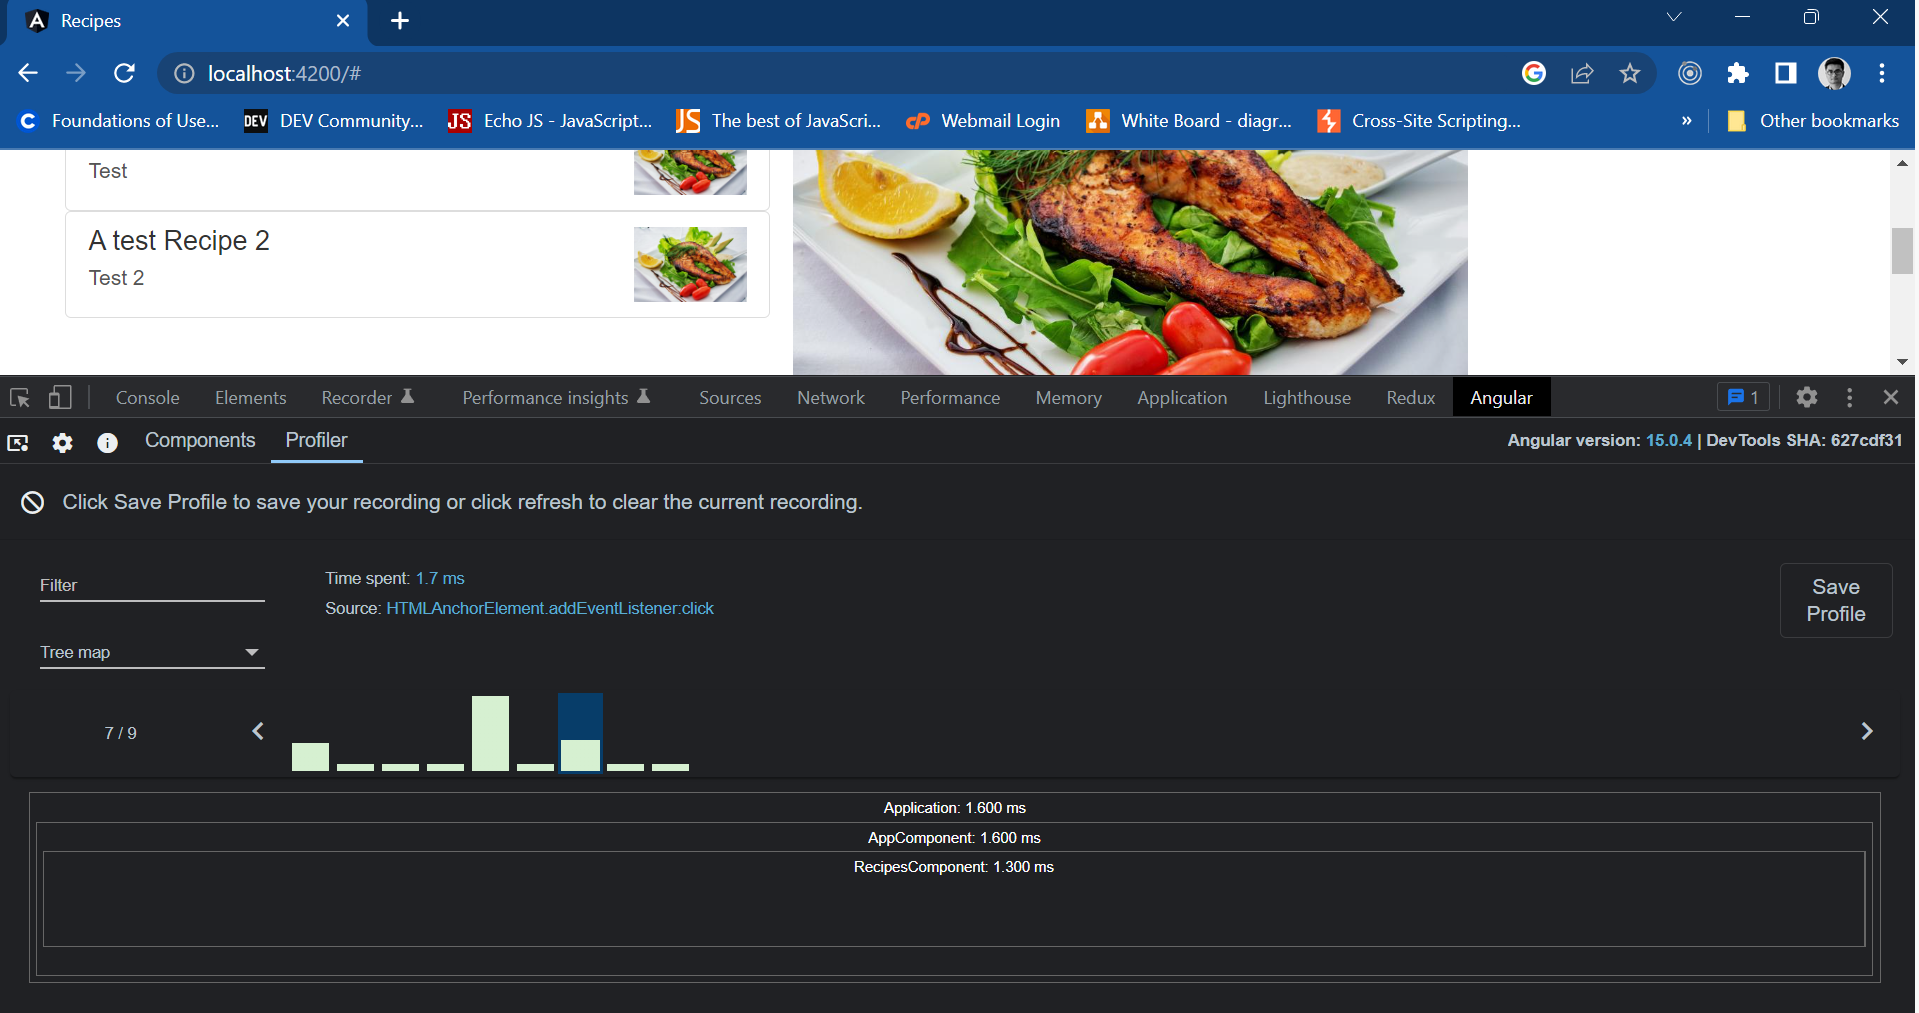
Integration with Chrome DevTools
Another unique advantage of Chrome Lighthouse is its integration with Chrome DevTools. This allows developers to use Lighthouse to test their websites in various scenarios, such as simulating a slow network or CPU throttling. This can help identify performance bottlenecks and provide a more accurate representation of how your website performs in real-world conditions.
There are several other tools and services that can be considered competitors to Chrome Lighthouse in the area of website performance testing and optimization. Some of the key competitors include:
- GTmetrix – a website performance analysis tool that provides insights on website speed, performance, and optimization tips.
- WebPageTest – a free online tool that analyzes a website’s performance and provides detailed information on loading times, content breakdown, and more.
- Pingdom – a web performance monitoring tool that provides real-time insights on website uptime, page speed, and performance optimization.
- YSlow – a browser extension that analyzes web pages and provides suggestions for improving their performance based on Yahoo’s rules for high-performance websites.
- Google PageSpeed Insights – a tool that analyzes a web page and provides optimization suggestions to improve its performance.
- Dareboost – a web performance analysis tool that offers in-depth audits, optimization recommendations, and a range of monitoring features.
- New Relic – a performance monitoring tool that provides visibility into web application performance, user experience, and more.
- Cloudflare – a web performance and security service that offers a range of optimization features, including content delivery network (CDN) services, caching, and image optimization.
Here’s a quick comparison of the key parameters –
| Tool Name | Pricing | User Interface | Performance Metrics | Accessibility Testing | SEO Testing | Best Features |
| Chrome Lighthouse | Free | CLI, Browser Extension, DevTools | Performance Score, Load Time, First Contentful Paint, Largest Contentful Paint, Total Blocking Time, Cumulative Layout Shift | Yes | Yes | Automated testing, Best Practices and Opportunities report, Integration with Chrome DevTools |
| GTmetrix | Free/Paid | Web Interface | Page Load Time, Total Page Size, Requests, PageSpeed/YSlow Score, Waterfall Visualization, Timings | No | Yes | Test server locations, Video playback of page loading, API access, PDF reports |
| WebPageTest | Free/Paid | Web Interface | Load Time, Time to First Byte, Start Render, Speed Index, Fully Loaded Time, Video Rendering | No | No | Customizable test parameters, Multi-step transactions, API access, Advanced metrics |
| Pingdom | Paid | Web Interface | Response Time, Uptime, Page Speed, Page Size, Requests, Performance Grade | No | No | Real-time alerts, Public status pages, RUM (Real User Monitoring) |
| YSlow | Free | Browser Extension | Page Load Time, Total Page Size, Requests, YSlow Score, Performance Grade | No | Yes | Analysis of individual components, Customizable rule set, Integration with Firebug |
| Google PageSpeed Insights | Free | Web Interface | Performance Score, Load Time, First Contentful Paint, Largest Contentful Paint, Total Blocking Time, Cumulative Layout Shift | No | Yes | Optimization suggestions based on industry best practices, Mobile and Desktop analysis, Lighthouse integration |
| Dareboost | Paid | Web Interface | Performance Score, Load Time, First Byte Time, Speed Index, Fully Loaded Time, Waterfall Visualization | Yes | Yes | Monitoring of website uptime and performance, Customizable test scenarios, API access |
| New Relic | Paid | Web Interface | Application Response Time, Error Rate, Apdex Score, Throughput, Database Response Time | No | No | Real-time monitoring and alerting, Performance optimization recommendations, Integration with DevOps tools |
| Cloudflare | Free/Paid | Web Interface | Load Time, Total Page Size, Requests, PageSpeed/YSlow Score, Waterfall Visualization, Content Delivery Network Performance | No | No | DDoS protection, WAF (Web Application Firewall), Automatic image optimization, Edge caching |